Billing Dashboard
The billing report reflects three sets of data: billing, payment, and aging. The top of the dashboard includes totals for the dates selected for Ready to Bill, Billed, On Hold, Rejected and Payments.
With the from and to Date fields you define the period of time for the data you want to analyze.
From the Location drop-down, select the locations you want to include or all. Note: the date and location filters do not apply to the Accounts Receivable (AR Aging) graph.
The dashboard includes a graphic representation of Payments by Carrier and Accounts Receivable (AR Aging). You can hover over a bar in the graph to see information specific to that section. 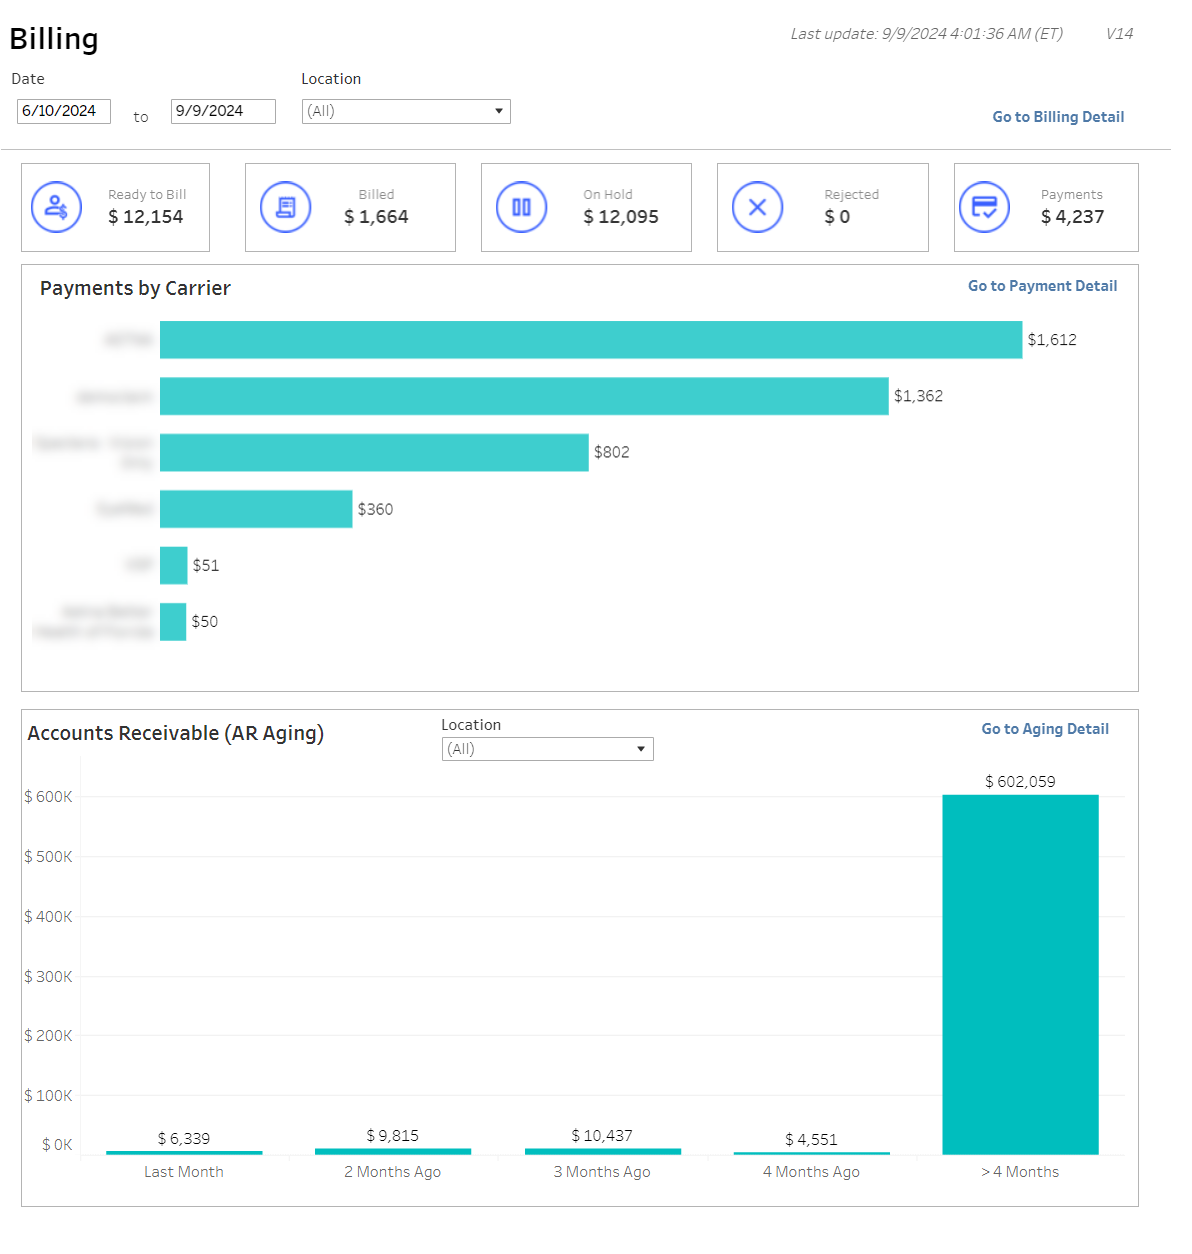
Click Go to Billing Detail at the top of the dashboard to view the Billing Details of the claims behind the values represented in Ready to Bill, Billed, On Hold, Rejected and Payments.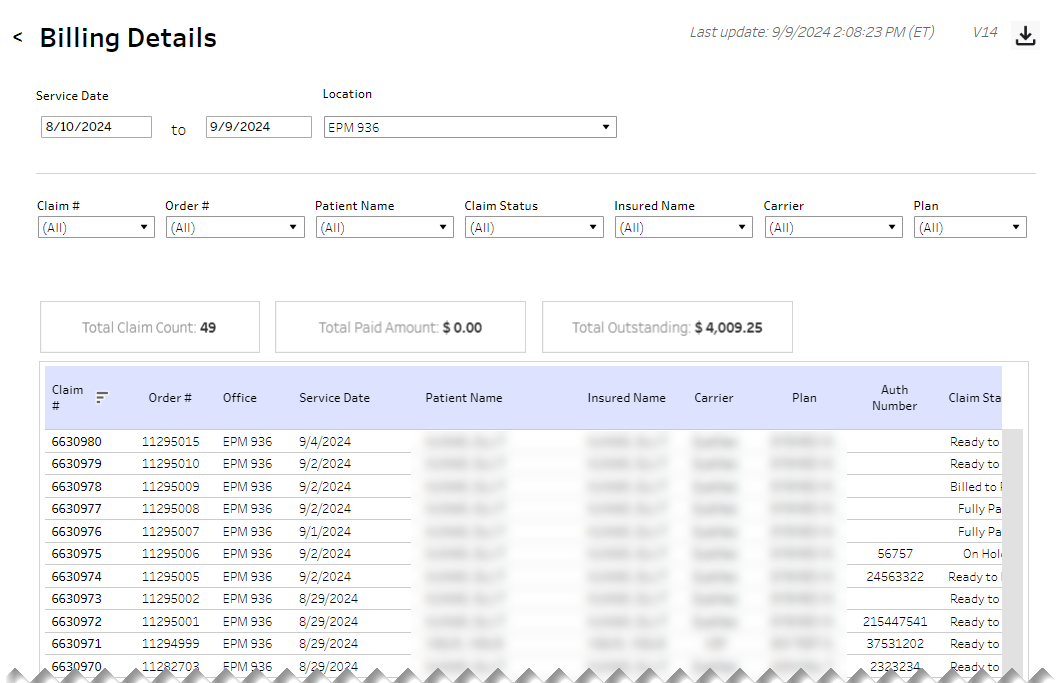
The details display in a table.
Above the table are filter fields you use to broaden or narrow the data in the table. Below the filter fields is an aggregation of the Total Claim Count, Total Paid Amount and Total Outstanding amount.
| Filter | Description |
|---|---|
| Claim # | Unique claim identifier |
| Order # | Unique order identifier |
| Patient Name | First and last name of patient |
| Claim Status | Status of claim |
| Insured Name | First and last name of insured party |
| Carrier | Name of the insurance carrier for the claim |
| Plan | Indicates which plan the insured/patient has with the carrier |
Dashboard Columns
Table columns can be sorted by selecting a column header followed by the up/down arrow.
| Field | Description |
|---|---|
| Claim # | Unique claim identifier |
| Order # | Unique order identifier |
| Office | Location where service was performed |
| Service Date | Date on which service was performed |
| Patient Name | First and last name of patient |
| Insured Name | First and last name of insured party |
| Carrier | Name of the insurance carrier for the claim |
| Plan | Indicates which plan the insured/patient has with the carrier |
| Authorization # | Unique identifier for authorization |
| Claim Status | Status of claim |
| Paid Amount | Amount that has been paid |
| Outstanding Balance | Amount still owed |
From the Payment by Carrier graph, click Go to Payment Detail to explore the data behind this chart.
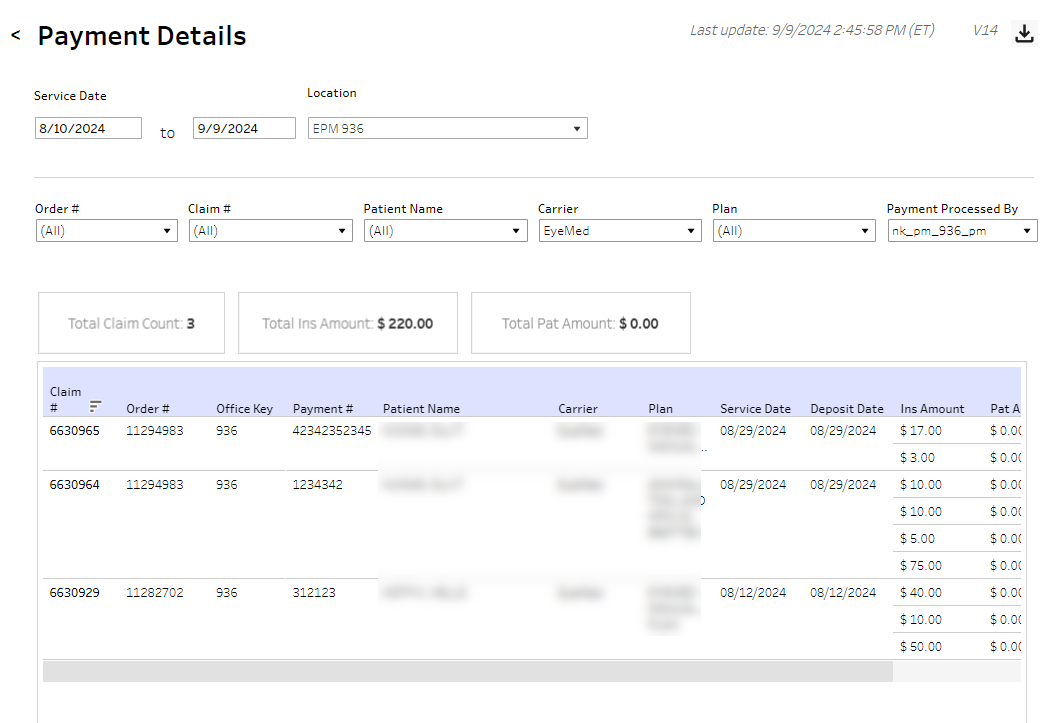
Above the table are filter fields you use to broaden or narrow the data in the table. Below the filter fields is an aggregation of the Total Claim Count, Total Ins Amount and Total Pat Amount.
| Filter | Description |
|---|---|
| Order # | Unique order identifier |
| Claim # | Unique claim identifier |
| Patient Name | First and last name of patient |
| Carrier | Name of the insurance carrier for the claim |
| Plan | Indicates which plan the insured/patient has with the carrier |
| Payment Processed By | Identifies staff member who processed the payment |
Table columns can be sorted by selecting a column header followed by the up/down arrow.
| Field | Description |
|---|---|
| Claim # | Unique claim identifier |
| Order # | Unique order identifier |
| Office Key | Identifies office where service occurred |
| Payment # | Unique payment identifier |
| Patient Name | First and last name of patient |
| Carrier | Name of the insurance carrier for the claim |
| Plan | Indicates which plan the insured/patient has with the carrier |
| Service Date | Date service occurred |
| Deposit Date | Date deposit was paid |
| Ins Amount | Amount covered/paid by insurance |
| Payment Amount | Amount owed/paid by patient |
| Payment Processed By | Staff member who processed the payment |
From the Accounts Receivable (AR Aging) graph, you can narrow the graph data using the Location drop-down in the graph. The date and location filters at the top of the dashboard do not apply to this graph or the Aging Detail. The data in this graph and the Aging Detail is based on all outstanding billing receivables in the system and is not driven by dates.
You can click Go to Aging Detail and the aging detail displays in a table. Along with Location, you can further narrow the detail data by Age category - selecting the check box to include All, 2 Months Ago, 3 Months Ago, 4 Months Ago, >4 Months, Current and/or Last Month.
Above the table are aggregate amounts for Total Claim Count and Total Balance.
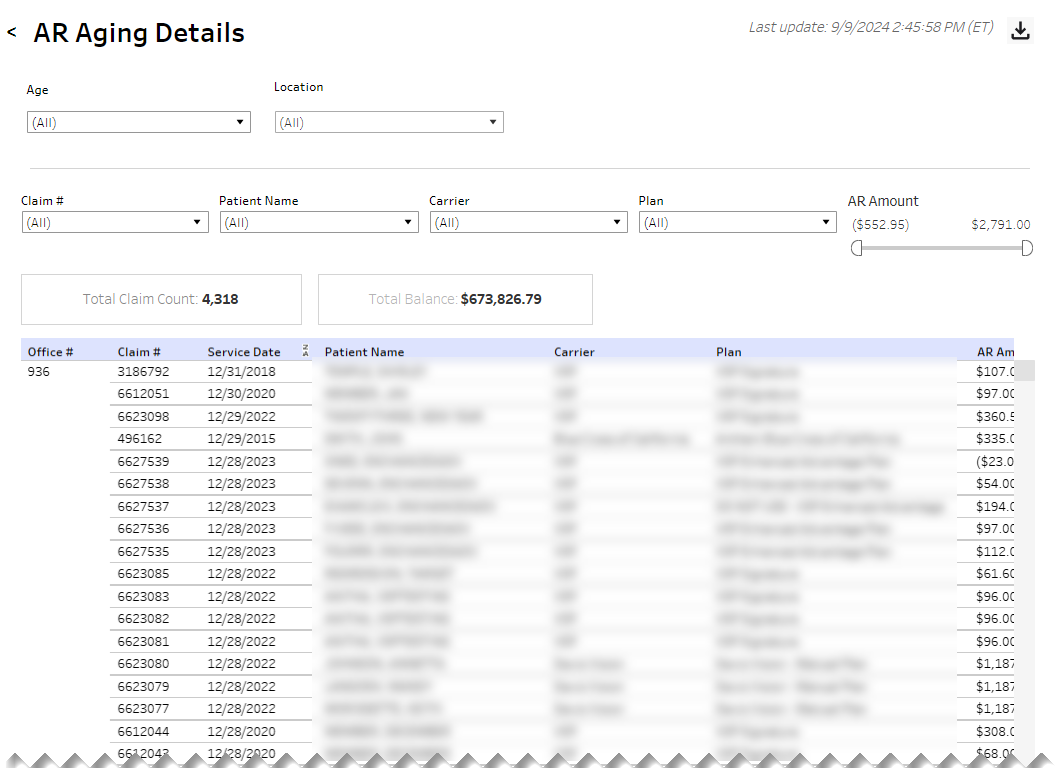
| Filter | Description |
|---|---|
| Claim # | Unique claim identifier |
| Patient Name | First and last name of patient |
| Carrier | Name of the insurance carrier for the claim |
| Plan | Indicates which plan the insured/patient has with the carrier |
| AR Amount | ????????? |
Table columns can be sorted by selecting a column header followed by the down arrow.
| Field | Description |
|---|---|
| Office # | Indicates office where service was performed |
| Claim # | Unique claim identifier |
| Service Date | Date service occurred |
| Patient Name | First and last name of patient |
| Carrier | Name of the insurance carrier for the claim |
| Plan | Indicates which plan the insured/patient has with the carrier |
| AR Amount | ??????? |
At the top of the page, next to the date the data was last updated, is the down-arrow icon to download the data. When you click the icon, a pop-up displays.
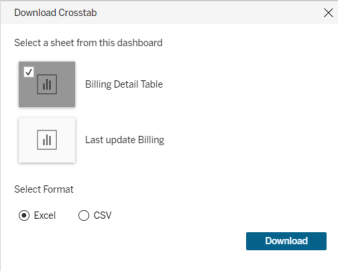
Select a sheet. Sheets represent individual data elements on the dashboard. Typically, the sheet labeled "Detail Table" contains the entire data set.
Select the format (Excel or CSV) and then click Download.