Patient Demographics Dashboard
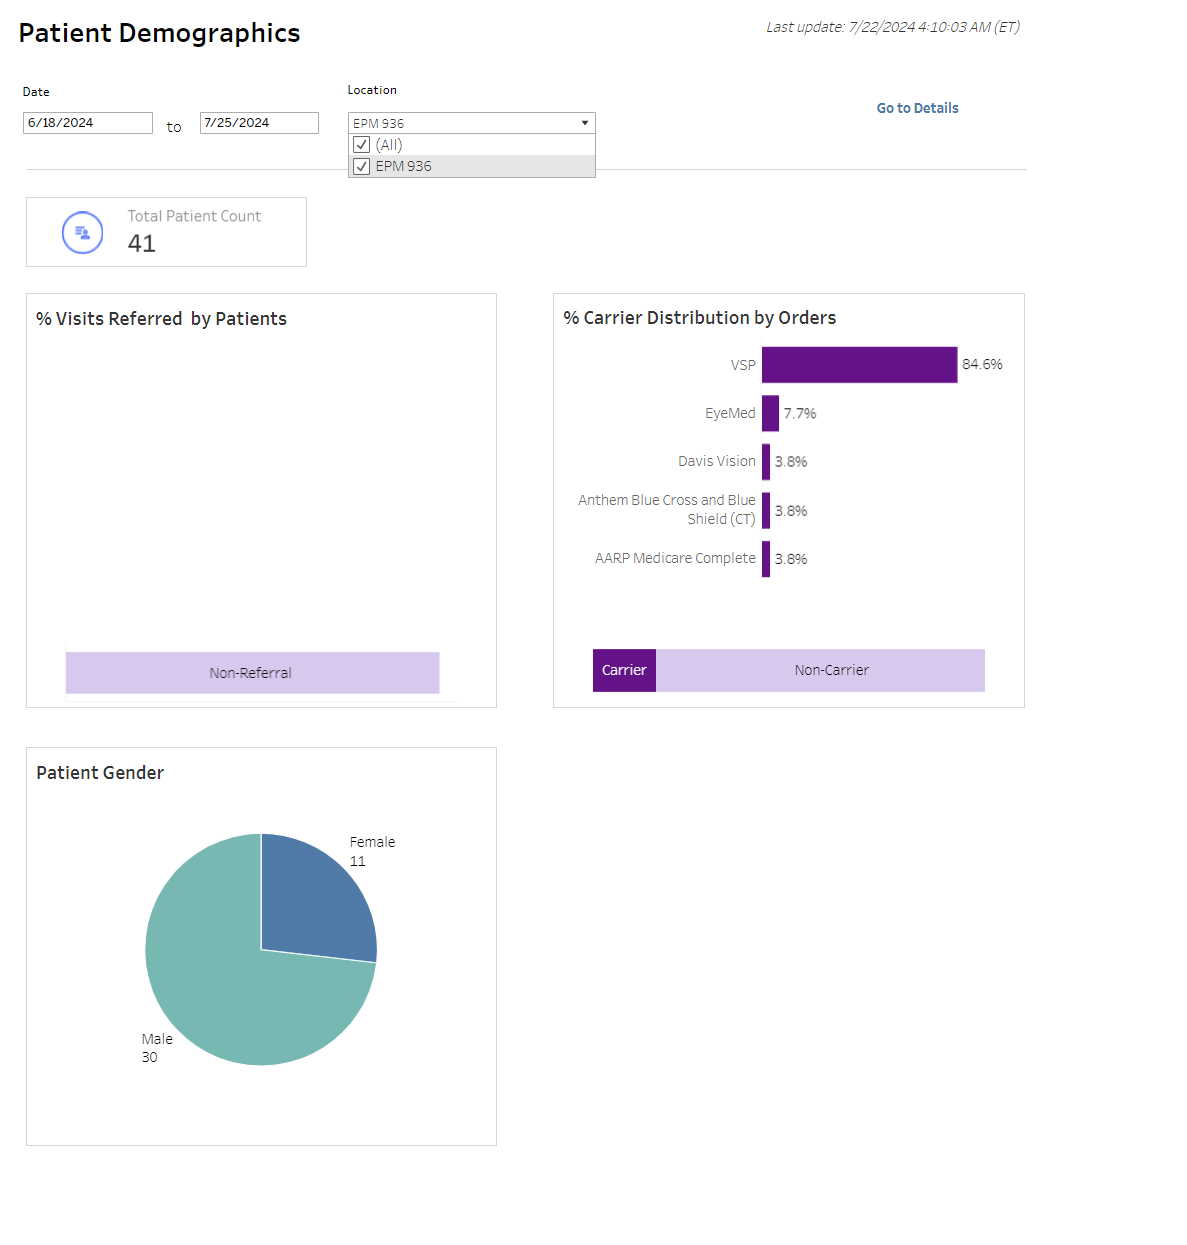
The Patient Demographics dashboard includes graphic representation of Total Patients Served, All-Time Patients, how your patients were referred to your practice, how your orders are distributed by carrier and the percentage of your patients by gender.
With the from and to Date fields you define the period of time you want to view to analyze demographics of patient orders.
From the Location drop-down, select the locations you want to include or all. You can also hover over a portion of the graph to view information specific to that section.

Click Go to Details to view more information.
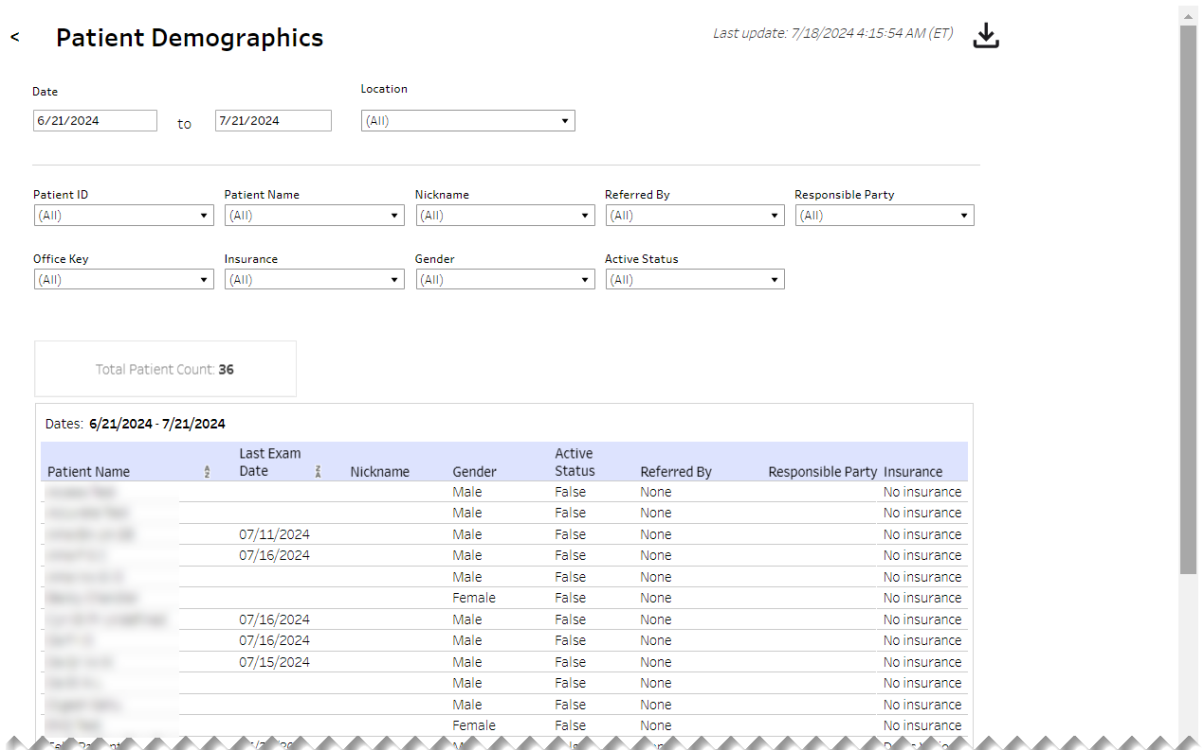
From the Details screen, the data selected displays in a table.

Above the table are filter fields you use to broaden or narrow the data in the table. Below the filter fields is the Total Patient Count aggregation.
| Filter | Description |
|---|---|
| Patient ID | Unique identifier for the patient |
| Patient Name | First and last name of patient |
| Nickname | Patient nickname |
| Referred By | Name of doctor/specialist who referred the patient |
| Responsible Party | Party responsible for the insurance plan |
| Office Key | Identifies office where service occurred |
| Insurance | Patient insurance provider |
| Gender | Identifies patient's gender |
| Active | Displays patient status within the practice |
Table columns can be sorted by selecting a column header followed by the up/down arrow.
| Field | Description |
|---|---|
| Patient Name | First and last name of patient |
| Last Exam Date | Date patient was last seen for a service |
| Nickname | Patient nickname |
| Gender | Identifies patient's gender |
| Active Status | Displays patient status within the practice |
| Referred By | Name of doctor/specialist who referred the patient |
| Responsible Party Insurance | Insurance provider of the responsible party |
| Next Recall Type | Method by which to send recall notification to patient |
| Recall Date | Date for next recall visit |
| Patient ID | Unique identifier for the patient |
| Office Key | Identifies office where service occurred |
At the top of the page, next to the date when the data was last updated, is the down-arrow icon to download the data. When you click the icon, a pop-up displays.
Select the Demographics Detail Table sheet. Sheets represent individual data elements on the dashboard. Typically, the sheet labeled "Detail Table" contains the entire data set.
Select the format (Excel or CSV) and then click Download.