Sales Revenue Dashboard
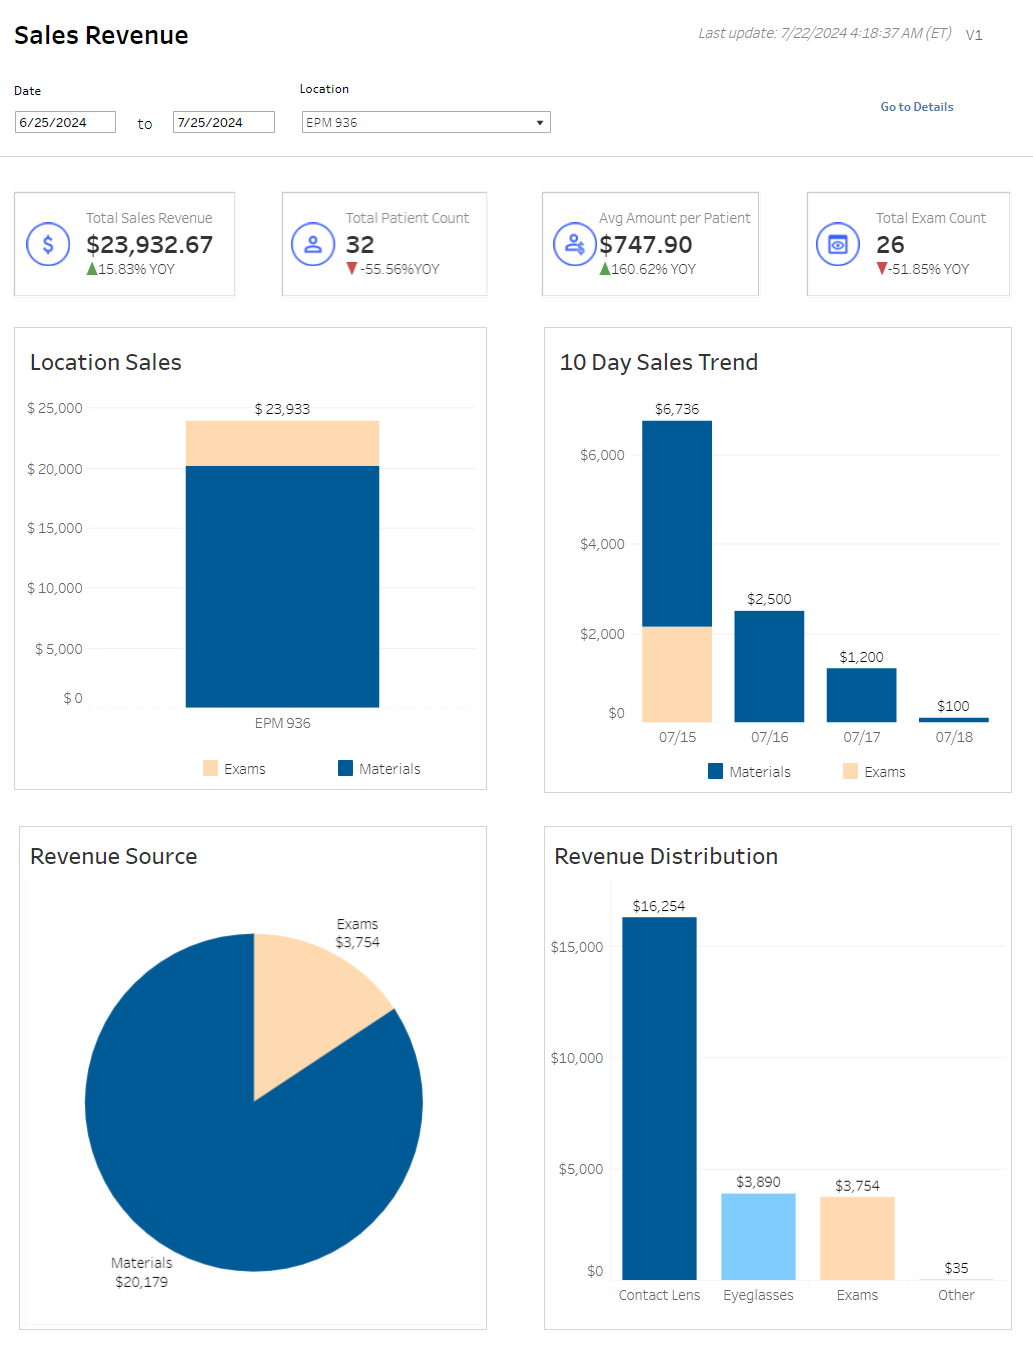
From the Sales Revenue dashboard, view your Total Sales Revenue, Total Patient Count, Average Sales Amount Per Patient and Total Exam Count; also with an indication if these totals are up or down compared to the same time period last year.
The dashboard also includes a graphical representation of Location Sales by exams and materials, the 10 Day Sales Trend, the Revenue Source both by materials and exams, and Revenue Distribution by contact lens, eyeglasses, exams and other. You can hover over a section of the graph to see the information specific to that section.
Use the date fields to define the time period you want to analyze sales. Select from the drop-down the Locations you want to include.
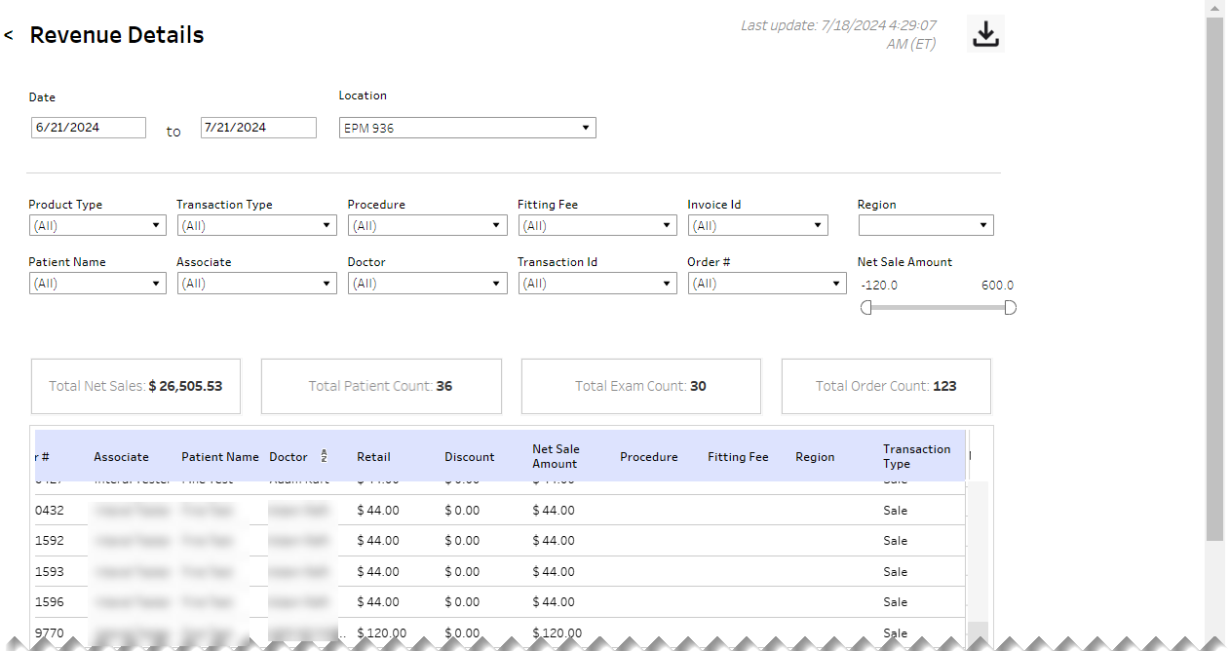
Click Go to Details for more information. The data displays in a table.

Above the table are filter fields you can use to broaden or narrow the data that displays in the table and table aggregations for the Total Patient Count, Total Exam Count, Total Order Count, Total Net Sales, Total Pat Amount, and Total Ins Receivable.
| Filter | Description |
|---|---|
| Product Type | Indicates the type of product |
| Transaction Type | Indicates what type of transaction occurred |
| Procedure | Type of procedure performed |
| Fitting Fee | The cost of the frame fitting |
| Invoice Id | Unique identifier for the invoice |
| Region | Region in which service was performed/office/practice is located |
| Patient Name | First and last name of patient |
| Associate | Name of associate who performed the transaction |
| Doctor | Provider on the patient exam |
| Transaction Id | Unique identifier for the transaction |
| Order # | Unique identifier for the order |
| Net Sale Amount | Range of overall amount of earned income on a given sale |
Table columns can be sorted by selecting a column header followed by the up/down arrow.
| Field | Description |
|---|---|
| Office # | Unique identifier for the order |
| Office name | Name of office where sale was made through |
| Product Type | Indicates the type of product |
| Lens Category | Indicates category of lens |
| Lens Manufacturer | Company that makes lenses ordered |
| Lens Style | Indicates the style of lens |
| Lens Type | Indicates the type of lens |
| Transaction Date | Date of the transaction |
| Transaction Id | Unique identifier for the transaction |
| Invoice Id | Unique identifier for the invoice |
| Order # | Unique identifier for the order |
| Associate | Name of the associate who ran the order |
| Patient Name | First and last name of patient |
| Doctor | Provider on the patient exam |
| Retail | Retail cost of the item |
| Discount | Percentage deducted from the cost of an item |
| Net Sale Amount | Range of overall amount of earned income on a given sale |
| Procedure | Type of procedure on performed on/for patient |
| Fitting Fee | The cost of the frame fitting |
| Region | Region in which service was performed/office/practice is located |
| Transaction Type | Region in which service was performed/office/practice is located |
| Patient Amount | Amount owed by the patient |
| Receivable | Insurance receivable |
| Tax | Amount of tax owed |
At the top of the page, next to the date when the data was last updated, is the down-arrow icon to download the data. When you click the icon, a pop-up displays.
Select the Marketing Detail Table sheet. Sheets represent individual data elements on the dashboard. Typically, the sheet labeled "Detail Table" contains the entire data set.
Select the format (Excel or CSV) and then click Download.