Sales by Provider & Staff Dashboard
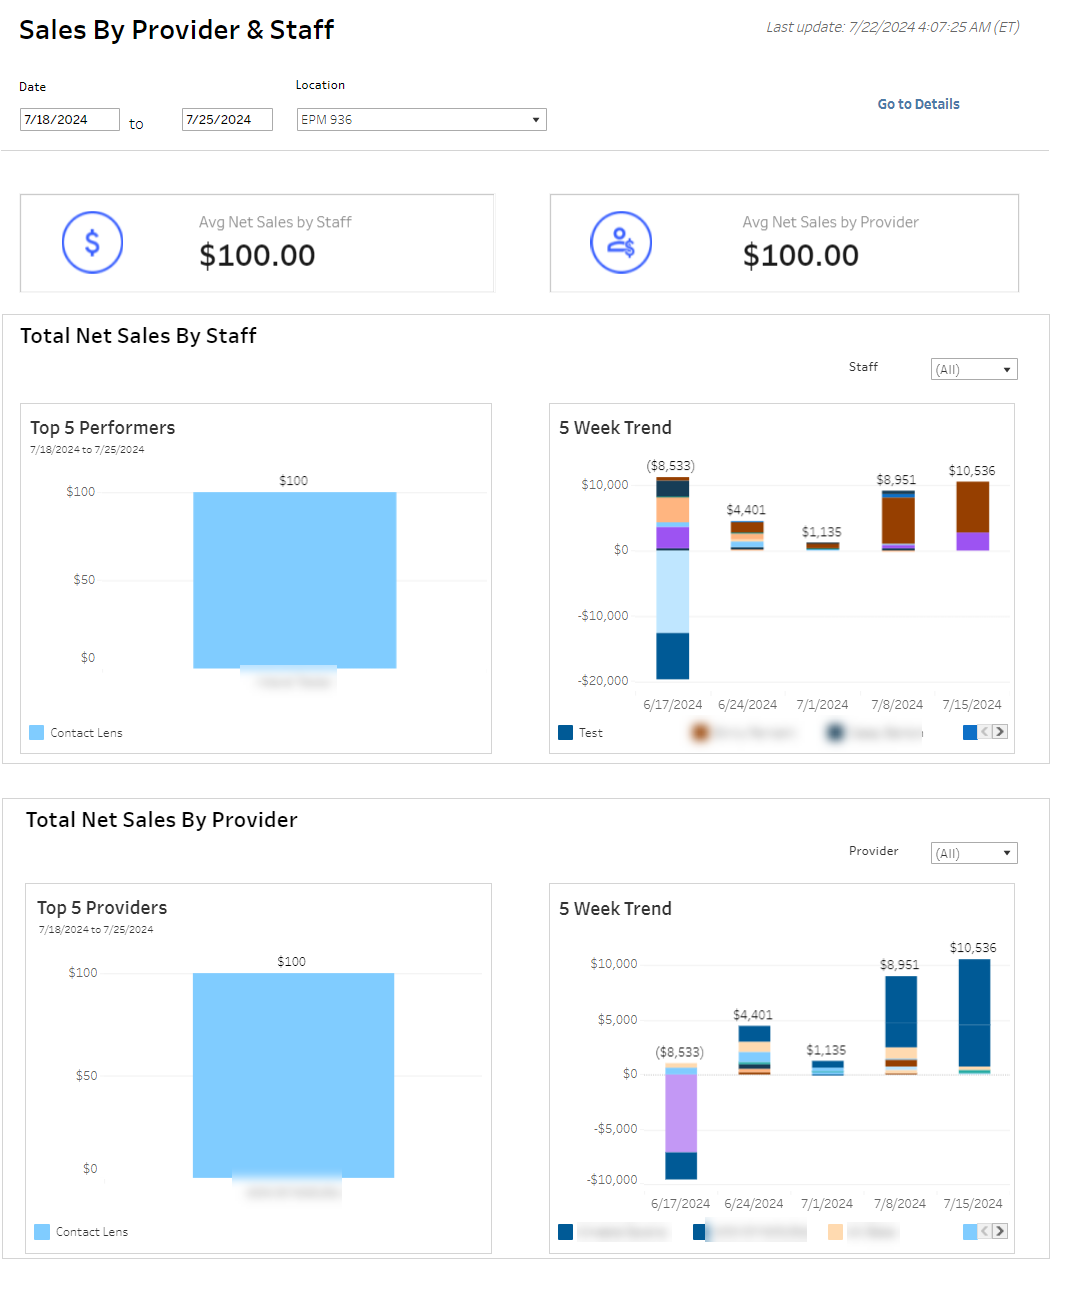
With the Sales by Provider & Staff dashboard, see your total average net sales by staff and by provider. For both staff and providers, get a graphical view of your Top Five Performers and the Five Week Trend that shows totals by staff/provider. You can hover over a section of the graph to see the information specific to that section.
Use the date fields to select the time period you want to analyze. From the Location drop-down, select all or each location you want to include.
For the Total Net Sales by Staff chart, you can select the staff members you want to include with the Staff drop-down. Sales are divided into services, contact lens and eyeglasses. You can also narrow the Total Net Sales By Provider chart by Provider.
Click Go to Details for more information. The data displays in a table.

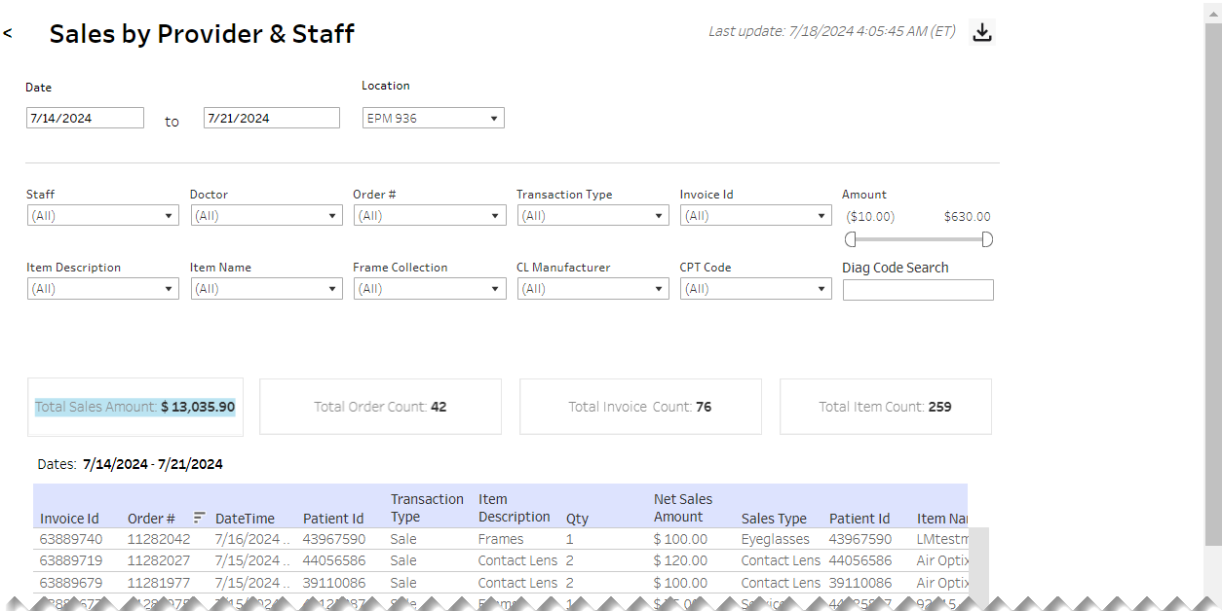
Above the table are filter fields you can use to broaden or narrow the data that displays in the table and fields that display the table aggregations Total Sales Amount, Total Order Count, Total Invoice Count and Total Item Count.
| Filter | Description |
|---|---|
| Staff | Staff member who input the order |
| Doctor | Provider on the patient exam |
| Order # | Unique identifier for the order |
| Transaction Type | Indicates what type of transaction occurred |
| Invoice Id | Unique identifier for the invoice |
| Amount | Amount of the invoice |
| Item Description | Description of the item/s ordered |
| Item Name | Name of the item/s |
| Frame Collection | List of collections frames belong to that patients can select from |
| CL Manufacturer | Contact lens manufacturer |
| CPT Code | CPT code associated with a given visit or diagnosis |
| Diag Code | List of diagnostic codes to search through |
For the Diag Code, you can search and select the code. Enter all or a partial code and click on the circle arrow icon to find and select the code.
| Field | Description |
|---|---|
| Invoice Id | Unique identifier for the invoice |
| Order # | Unique identifier for the order |
| DateTime | Date and time of invoice |
| Patient Id | Unique identifier for the patient |
| Transaction Type | Indicates what type of transaction occurred |
| Item Description | Description of the item/s ordered |
| Qty | Number of items sold |
| Net Sales Amount | Amount of net sales generated |
| Sales Type | Category of sales generated |
| Patient Id | Unique identifier for the patient |
| Item Name | Name of the item/s |
| CL Manufacturer | Contact lens manufacturer |
| Frame Collection | List of collections frames belong to that patients can select from |
| CPT Code | CPT code associated with a given visit or diagnosis |
| DiagCode 1 | Diagnosis code 1 |
| DiagCode 1 Description | Description of diagnosis code 1 |
| DiagCode 2 | Diagnosis code 2 |
| DiagCode 2 Description | Description of diagnosis code 2 |
| DiagCode 3 | Diagnosis code 3 |
| DiagCode 3 Description | Description of diagnosis code 3 |
| Doctor | Provider on the patient exam |
| Staff | Staff member who input the order |
| Office # | Unique identifier for the order |
| Company ID | Unique identifier for company manufacturing items sold |
Table columns can be sorted by selecting a column header followed by the up/down arrow.
At the top of the page, next to the date when the data was last updated, is the down-arrow icon to download the data. When you click the icon, a pop-up displays.
Select the Marketing Detail Table sheet. Sheets represent individual data elements on the dashboard. Typically, the sheet labeled "Detail Table" contains the entire data set.
Select the format (Excel or CSV) and then click Download.