Creating and Printing Custom Fee Slip Reports
- Open the Reports & Statements window and click the Custom tab. For more information on opening this window, go to Opening the Reports & Statements Window.
- Select Fee Slip Reports from the Report Name list and click Open.
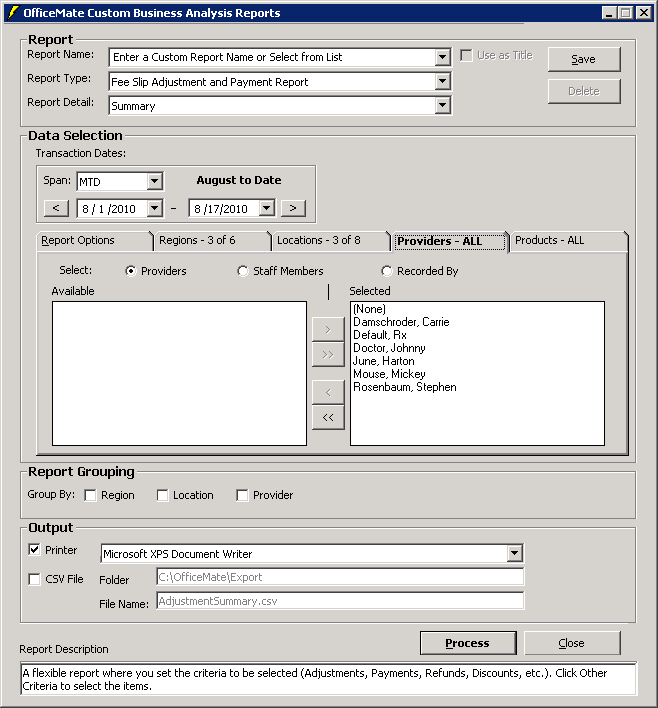
The Custom Business Analysis Reports window opens.
- Select a report from the Report Type drop-down menu.
- Select the level of detail that you want to display in the report from the Report Detail drop-down menu.
- Select a date range for the fee slips you want to include in the report:
- Select a range from the Span drop-down menu and use the left and right arrows to advance the time period.
OR
- Enter beginning and ending dates in the date range fields.
- Select a range from the Span drop-down menu and use the left and right arrows to advance the time period.
- To load previously saved report settings, click Load and skip to step 13.
Previously saved report settings do not affect the selection dates.
- If you selected the Fee Slip Adjustment and Payment report, refine the report results by selecting the report options, as needed:
- Click the Report Options tab.
- Select only the adjustment and payment types that you want to include in the report in the Selected box.
To select more than one adjustment or payment type, press and hold the Ctrl key and then select multiple items from the list.
- Click the single left arrow (<) to move an adjustment or payment type to the Available box, and therefore, exclude it from the report.
- Click one of the double arrows (<< or >>) to move all the adjustments and payment types from one box to another.
- Refine the report results by selecting the regions you want to include, as needed:
- Click the Regions tab.
- Select only the regions that you want to include in the report in the Selected box.
To select more than one region, press and hold the Ctrl key and then select multiple regions.
- Click the single left arrow (<) to move a region to the Available box, and therefore, exclude the region from the report.
- Click one of the double arrows (<< or >>) to move all the regions from one box to another.
- Refine the report results by selecting the locations you want to include, as needed:
- Click the Locations tab.
- Select only the locations that you want to include in the report in the Selected box.
To select more than one location, press and hold the Ctrl key and then select multiple locations.
- Click the single left arrow (<) to move a location to the Available box, and therefore, exclude the location from the report.
- Click one of the double arrows (<< or >>) to move all the locations from one box to another.
- Refine the report results by selecting the providers or staff you want to include, as needed:
- Click the Providers tab.
- Select the Providers, Staff Members, or Recorded By radio button to limit the providers or staff that are available to select.
- Select only the providers or staff members that you want to include in the report in the Selected box.
To select more than one provider or staff member, press and hold the Ctrl key and then select multiple names.
- Click the single left arrow (<) to move a provider or staff member to the Available box, and therefore, exclude the provider or staff member from the report.
- Click one of the double arrows (<< or >>) to move all the providers or staff members from one box to another.

- Refine the report results by selecting the products you want to include, as needed:
- Click the Products tab.
- Select the Financial Groups, Production Groups, or Attributes radio button to narrow the report results by financial group, production group, or attribute.
- Select only the financial groups, production groups, and attributes that you want to include in the report in the Selected box.
To select more than one product, press and hold the Ctrl key and then select multiple products.
- Click the single left arrow (<) to move a product to the Available box, and therefore, exclude the product from the report.
- Click one of the double arrows (<< or >>) to move all the products from one box to another.
- Select the Report Grouping check boxes to sort the report results into groups, as needed. You can select any number of the check boxes that are available. Not all check boxes are available for all reports.
- To save the report settings for future use, see Saving Custom Report Settings.
- Select the Printer check box.
- Select a printer from the drop-down menu.
- Click Process.
The Report Viewer window opens and displays a preview of the report, chart, or graph.
- Click the Print Report icon.
- Close the Report Viewer window when finished.
For more information about the Report Viewer window, go to Using the Report Viewer Window.
- Select the CSV File check box.
- Type a folder location in the Folder text box.
- Type a name for the file in the File Name text box.
- Click Process.
- Click View File to view the data in the CSV format.