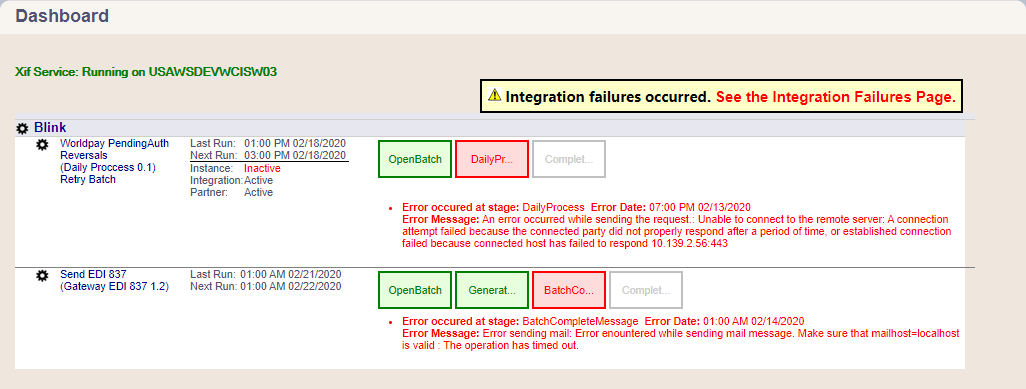
AcuityLogic X-Link Dashboard
The Dashboard is the page you see when you first log in to AcuityLogic X-Link. It shows all integrations that are in progress or have errors. It also shows each integration's last run time and next run time.
Each stage of an integration is represented by a box and a color:
| Color | Definition |
|---|---|
|
Green |
Stage has successfully completed |
|
Red |
Error occurred during stage |
|
Gray |
Stage hasn’t started |
If an error occurs at any stage, the stage is red on the Dashboard, and an error message that explains when and why the error occurred appears.
To see a list and details about integration failures, click See the Integration Failures Page. The Integration Failures page currently shows failures for the Submit Optiport Orders integration. See Viewing the Integration Failures Page in AcuityLogic X-Link.
