Reviewing Custom Reports
Custom reports enable you to view a report's raw data as a spreadsheet. The controls for selecting filters and navigation are identical to those used in visualizations. For more information, see Reviewing Visualizations.

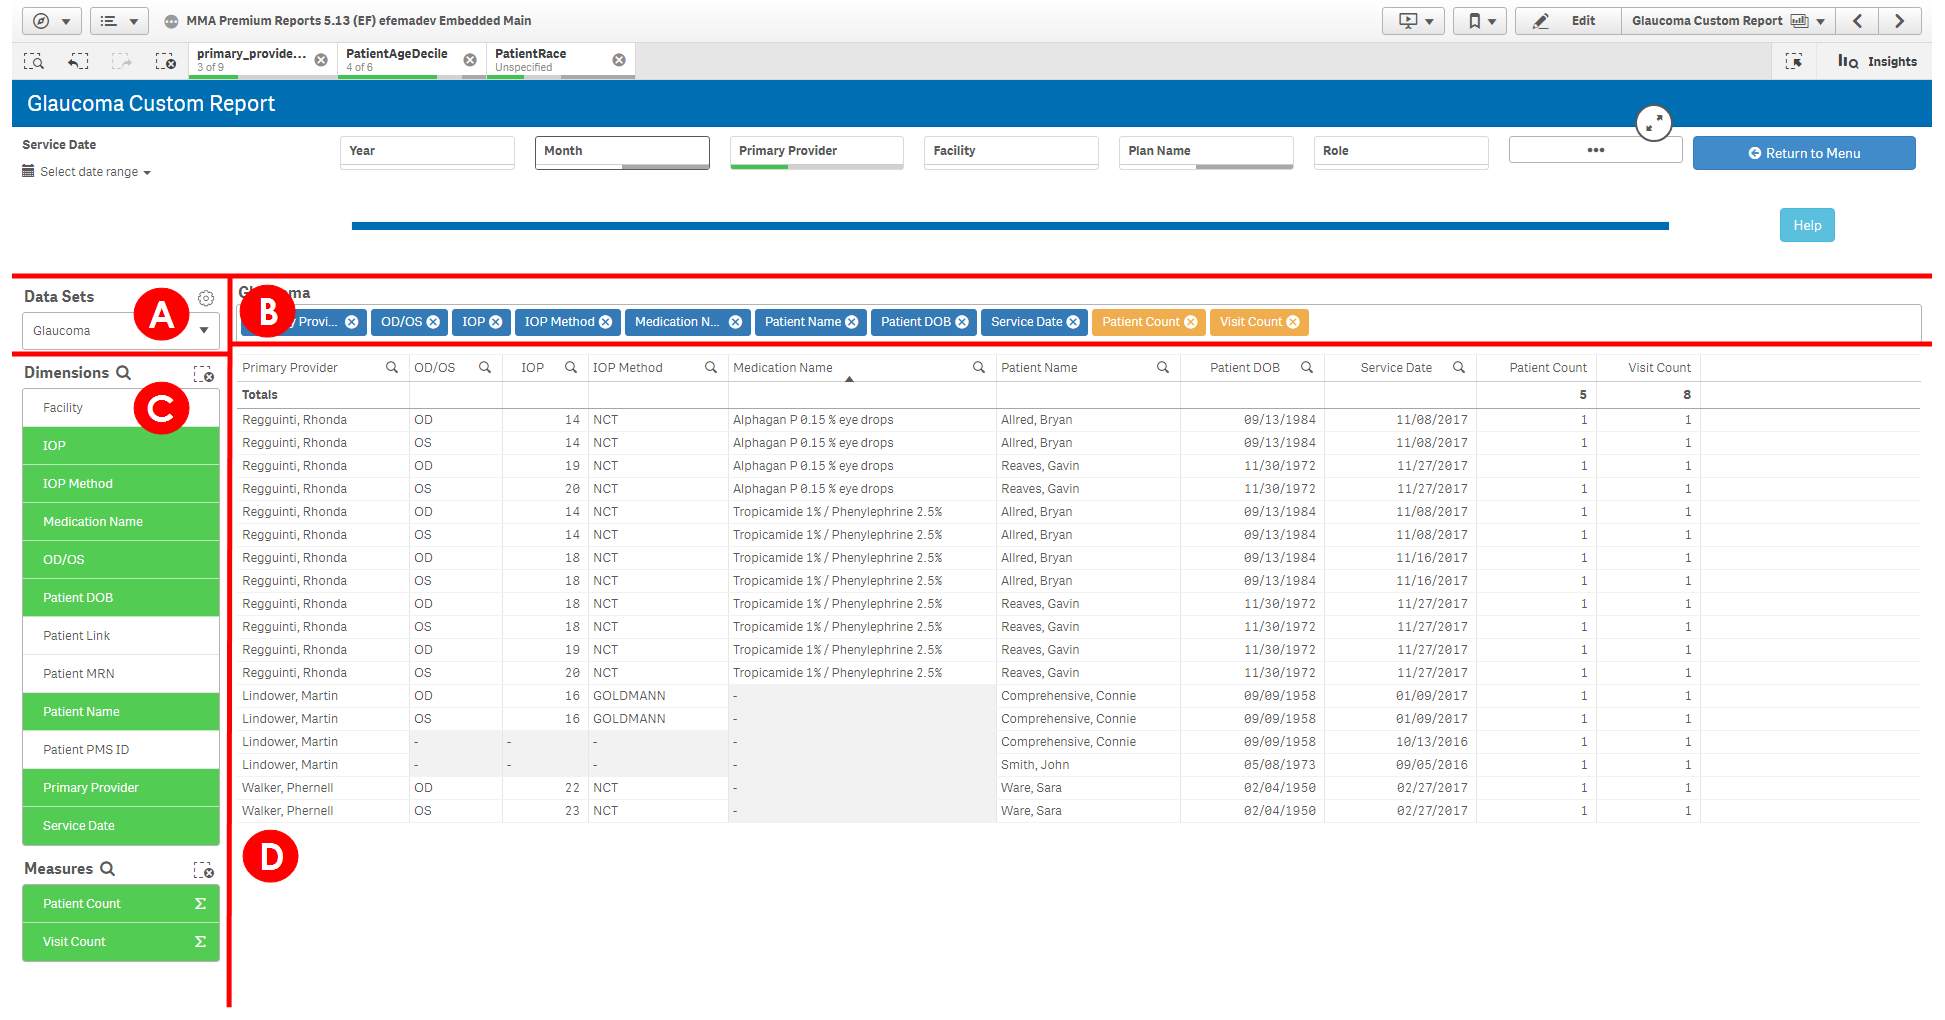
In addition to filters, you can modify custom reports using the following elements:
-
Data Sets. Displays the data set that is currently selected. Clicking the gear icon enables you to export your current spreadsheet to your computer as a .xlsx file. For more information on exporting reports, see Exporting Reports.
You can open .xlsx files using programs such as Microsoft Excel, Apache OpenOffice Calc, and Google Sheets.
- Patient Data Table. Shows the dimensions and measures you've selected. Click the x for a dimension or measure to remove it.
- Dimensions and Measures. Enables you to select which columns of data appear in the spreadsheet. You can search for a particular dimension or measure by clicking the magnifying glass and typing the name of the term you're looking for.
- Spreadsheet. Displays data based on the filters, dimensions, and measures you've selected. You can click a column heading to sort by that column or drag the heading to change the order of columns. You can also select and deselect filters by clicking on data directly.